Welcome to the ABPEPserver!
ABPEPserver offers the visualization of a large-scale proteomics analysis of multiple human cancer types in which aberrant peptides are detected. In this analysis, tryptophan to phenylalanine (W>F) codon reassignment were found to be a vastly abundant phenomenon in multiple cancer types. Furthermore, these W>F mis-incorporations, called W>F substitutants, were found to be enriched in tumors as compared with adjacent normal tissues, and often their appearance was associated with T-cell and oncogenic signaling activities.
Proteomic cancer data from multiple cancer types, hosted by PDC commons database, have been used in this analysis. An in depth description of how the analysis was conducted is shown in the 'Methods' tab. The 'Cancer types' tab shows cancer types analyzed and includes information about each proteomic dataset.
This server will enable ease and fast access to aberrant peptides, which are potent immunotherapeutic targets and hence of high value.
Results are available in:
- Barplots depicting cumulative number of W-substitutants detected in tumour and adjacent normal tissue samples.
- Violin plots depicting the number of Substitutants detected in low (intensity < 0) and high (intensity >0) tumor and adjacent normal tissue samples.
- Scatter contour plots depicting for every gene the number of W>F Substitutants when the gene is higher expressed (intensity > 0) on X-axis (High Class) and when the gene is lower expressed (intensity < 0) on Y-axis (Low Class).
- Excel file outputs with the list of aberrant peptides.
Background information
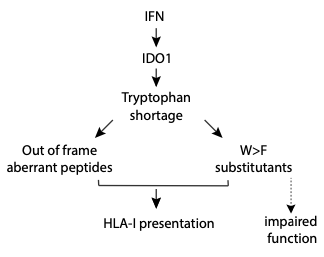
T-cells infiltrating tumour microenvironment secrete IFN-gamma (IFNγ) which activates Indoleamine 2,3-dioxygenase 1 (IDO1)
enzyme expression in cancer cells. IDO1 stimulates pathways that subvert T-cell immunity while also breaking down tryptophan in its process,
leading to a tryptophan deficiency.1 When a healthy cell is deficient in tryptophan, ribosomes will stop translation at the codon for
tryptophan. Therefore, protein synthesis will stop. Nevertheless, in Melanoma cells protein synthesis continues despite interferon gamma (IFNγ)-mediated
tryptophan depletion. They skip the firstnucleotide of the codon for tryptophan. Consequently, the whole reading frame jumps from that point on leading
to the synthesis of aberrant proteins as a result of ribosomal frameshifting at tryptophan codons. 2
In follow up studies, it was shown that IFNγ-mediated tryptophan shortage also impacts protein quality by generating specific mis-incorporations of
phenylalanine at tryptophan codons. This type of amino acid deprivation-induced codon reassignments are called ‘substitutants’ to distinguish them
from somatic genetic substitutions. Therefore, the absence of the essential amino acid tryptophan causes ribosomes to induce errors of two-types, i.e,
ribosomal frame-shifting and amino-acid substitutions.
Notes
1. Champagne J, Pataskar A, Blommaert N, et al. Oncogene-dependent sloppiness in mRNA translation
[published online ahead of print, 2021 Sep 21]. Mol Cell. 2021;S1097-2765(21)00736-X. doi:10.1016/j.molcel.2021.09.002.
2. Bartok, O., Pataskar, A., Nagel, R. et al. Anti-tumour immunity induces aberrant peptide presentation in melanoma.
Nature 590, 332–337 (2021). https://doi.org/10.1038/s41586-020-03054-1.
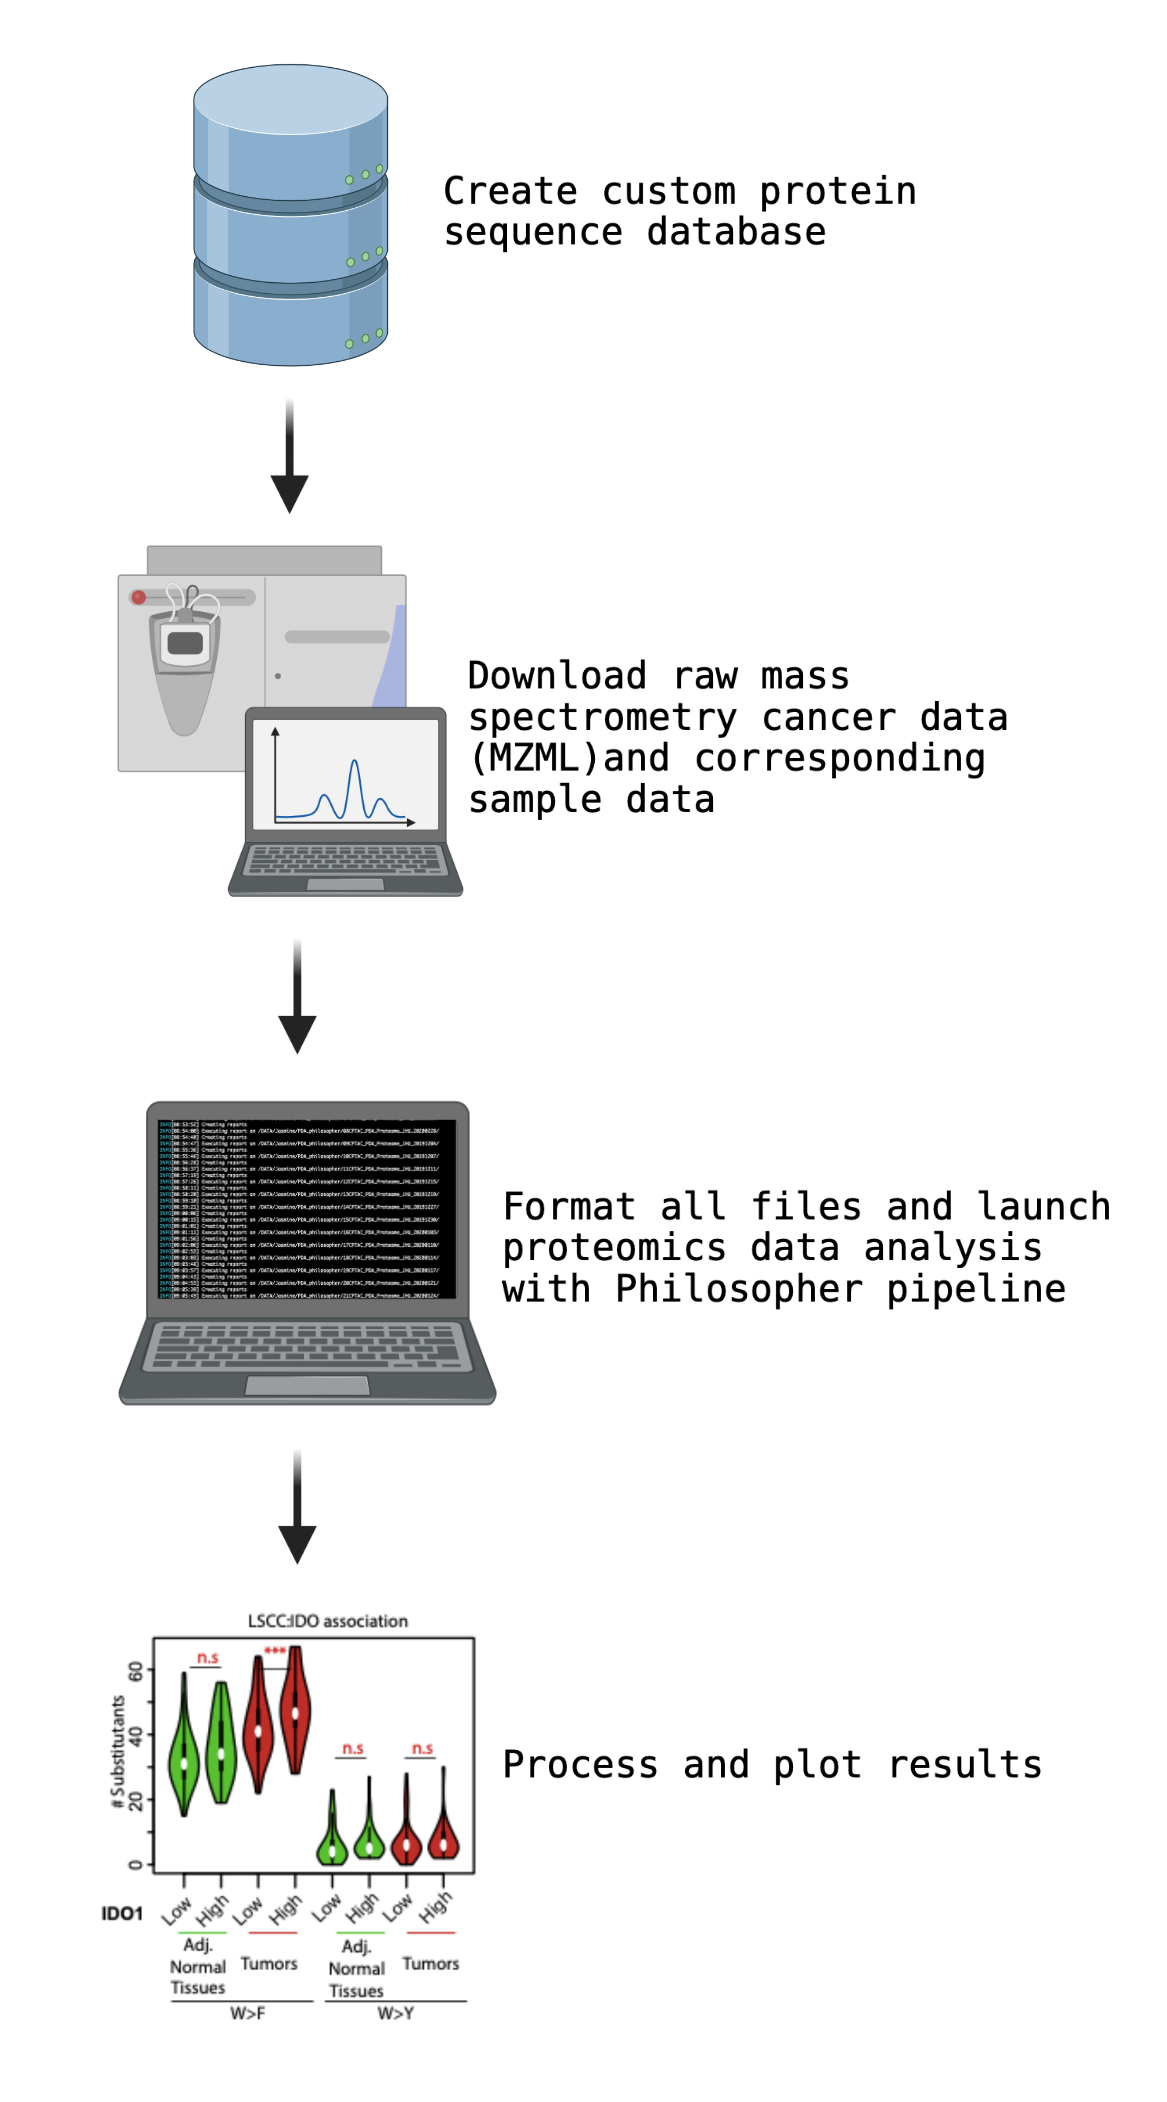
An important toolkit that has been be used in this analysis is Philosopher1,
a versatile toolkit for shotgun proteomics data analysis. This tool uses mass spectrometry data to rapidly do peptide quantification analysis,
search for PTMs, and many more relevant proteomics analyses.
Furthermore, this analysis can be divided into several steps:
- Creating a custom protein sequence database
- Obtaining required data and formatting them properly for the Philosopher pipeline
- Adjustment of Philosopher parameter file for desired analysis
- Launch proteomics data analysis with Philosopher pipeline toolkit
- Processing results
Creating a custom protein sequence database
The database of protein sequences was prepared in one of the two ways. First, the human proteome with all instances of tryptophan amino acids in the proteome changed to all other amino acids except Arginine and Lysine was used as a database in the scan – referred to as database 1(fully substitutant). Second, to optimize true positives, we generated a second database (optimized database) which includes addition to the canonical human proteome (UniPROT) with the substitutant tryptic peptides (length > 5 & < 50 amino acids) spanning tryptophan residue and tryptophan substituted to all other amino acids.Obtaining required data and formatting them properly for the Philosopher pipeline
To automatically download datasets and format them properly, a custom pipeline was written to:- Download proteomic dataset from PDC database in MZML file format
- Download the corresponding sample data and create an annotation file containing mappings
between the TMT channels and the sample labels for each of the whole proteome plexes - Create a folder for each of the whole proteome plexes and their annotation file
- Create folder named bin for software tools to be used (MSFragger, Philosopher and TMTIntegrator)
- Adjust the parameter file (explained in the following section)
- Create a folder named params for the parameters file
- Create a folder named database for the protein sequence FASTA file
Adjustment of Philosopher parameter file for desired analysis
By using the automated pipeline mode, all the necessary steps will automatically run. For this, the parameter file was used.MSFragger was used for peptide detection with the following parameters; Precursor mass lower: -20 ppm, Precursor mass upper: 20 ppm, precursor mass tolerance: 20ppm, calibrate mass: TRUE, Deisotoping: True, mass offset: FALSE, isotope error: STANDARD, digestion: Strictly tryptic (Max. missed cleavage: 2), Variable modifications (For iTRAQ datasets): 15.99490 M 3, 42.01060 [^ 1, 229.162932 n^ 1, 229.162932 S 1, Variable modifications (For TMT datasets): 15.99490 M 3, 42.01060 [^ 1, 144.1021 n^ 1, 144.1021 S 1, Min Length: 7, Max Length: 50, digest mass range: 500:5000 Daltons, Max Charge: 2, remove precursor range: -1.5, 1.5, topN peaks: 300, minimum peaks: 15, precursor range: 1:6, add Cysteine: 57.021464, add Lysine (for ITRAQ datasets): 144.1021, add Lysine (for TMT datasets): 229.162932,among other basic parameters.
PeptideProphet was then used for Peptide Validation with following parameters (accmass: TRUE, decoyprobs: TRUE, expectScore: TRUE, Glycosylation: FALSE, ICAT: FALSE, masswidth: 5 , minimum probability after first pass of a peptide: 0.9, minimum number of NTT in a peptide: 2, among other parameters.
Next, isobaric quantification was undertaken separately for TMT and iTRAQ datasets with following parameters (bestPSM: TRUE, level: 2, minProb 0.7, ion purity cut-off: 0.5, tolerance: 20 ppm, among other parameters. Thereafter, FDR filtering was implemented to retain only confident peptides with following parameters (FDR < 0.01, peptideProbability: 0.7, among other parameters.
Thereafter, TMT-integrator was used to integrate Isobaric Quantification with following parameters (retention time normalization: FALSE, minimum peptide probability on top of FDR filtering (TMT datasets): 0.9, minimum peptide probability on top of FDR filitering (for iTRAQ 32 dataset): 0.5, among other parameters).
Download TMT11 parameter file
Download TMT10 parameter file
Launch proteomics data analysis with Philosopher pipeline toolkit
Philosopher pipeline was used to detect all peptides in mass-spectrometry datasets (MZML files), including the substitutant peptides. To start the pipeline, the next Philosopher pipeline command is used:$ bin/philosopher pipeline --config params/[parameter file] [list of proteome plex directories]
Processing results
Substitutant peptides were fetched from the reports of TMT Integrator, and any detected peptide intensity score for a sample normalized to the reference channel above 0 (log-scale) was considered as a positive peptide for that sample using a R-script. R was used to plot density plots as well as Barplots for number of peptide detections. Next, protein expression profiles for each cancer type was downloaded in already analysed format from PDC database. PERL scripts were designed to count number of substitutants when a gene is lowly expressed (intensity <0) or highly expressed (intensity >0).Note
For intra-tumour type analysis, a filter for maximum number of samples was applied to retain peptides with higher specificity in expression, except for W>F substitutants because of their exclusive significant and specific distribution wherever significant. All tumour types have demonstrated to be exclusive with analysis of database 1 (Pataskar et al., 2022), while GBM, UCEC and PDA did not show this exclusivity in the analysis of database 2. This optimizes the signal for gene expression correlation analysis.
Clear Cell Renal Carcinoma
| PDC Study Identifier | PDC000127 |
| Study | Integrated Proteogenomic Characterization of Clear Cell Renal Cell Carcinoma |
| Quantitation strategy | Isobaric label quantitation |
| Isobaric Labeling reagent | TMT10 |
| # proteome plexes | 23 |
| # fractions per proteome plex | 25 |
| # tumour samples | 110 |
| # adjacent normal sample | 84 |

Glioblastoma
| PDC Study Identifier | PDC000204 |
| Study | Proteogenomic and metabolomic characterization of human glioblastoma |
| Quantitation strategy | Isobaric label quantitation |
| Isobaric Labeling reagent | TMT11 |
| # proteome plexes | 11 |
| # fractions per proteome plex | 24 |
| # tumour samples | 100 |
| # adjacent normal sample | 10 |

Head and Neck Squamous Cell Carcinoma
| PDC Study Identifier | PDC000221 |
| Study | Proteogenomic insights into the biology and treatment of HPV-negative head and neck squamous cell carcinoma |
| Quantitation strategy | Isobaric label quantitation |
| Isobaric Labeling reagent | TMT11 |
| # proteome plexes | 20 |
| # fractions per proteome plex | 25 |
| # tumour samples | 105 |
| # adjacent normal sample | 53 |

Hepatocellular Carcinoma
| PDC Study Identifier | PDC000198 |
| Study | Integrated Proteogenomic Characterization of HBV-Related Hepatocellular Carcinoma |
| Quantitation strategy | Isobaric label quantitation |
| Isobaric Labeling reagent | TMT11 |
| # proteome plexes | 33 |
| # fractions per proteome plex | 48 |
| # tumour samples | 165 |
| # adjacent normal sample | 165 |

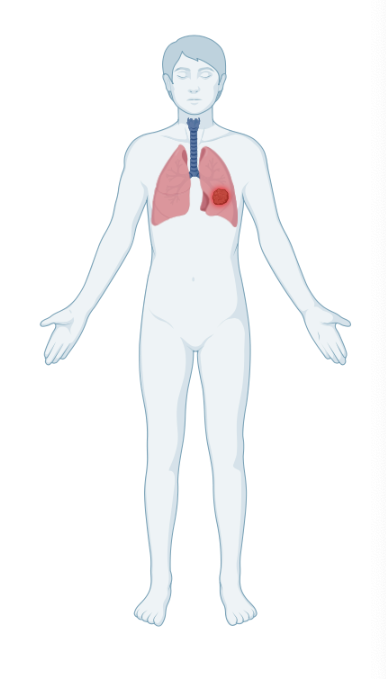
Lung Squamous Cell Carcinoma
| PDC Study Identifier | PDC000234 |
| Study | A proteogenomic portrait of lung squamous cell carcinoma |
| Quantitation strategy | Isobaric label quantitation |
| Isobaric Labeling reagent | TMT11 |
| # proteome plexes | 22 |
| # fractions per proteome plex | 25 |
| # tumour samples | 110 |
| # adjacent normal sample | 101 |
Ovarian Serous Cystadenocarcinoma
| PDC Study Identifier | PDC000110 |
| Study | Integrated Proteomic and Glycoproteomic Characterization of Human High-Grade Serous Ovarian Carcinoma |
| Quantitation strategy | Isobaric label quantitation |
| Isobaric Labeling reagent | TMT10 |
| # proteome plexes | 13 |
| # fractions per proteome plex | 24 |
| # tumour samples | 84 |
| # adjacent normal sample | 22 |

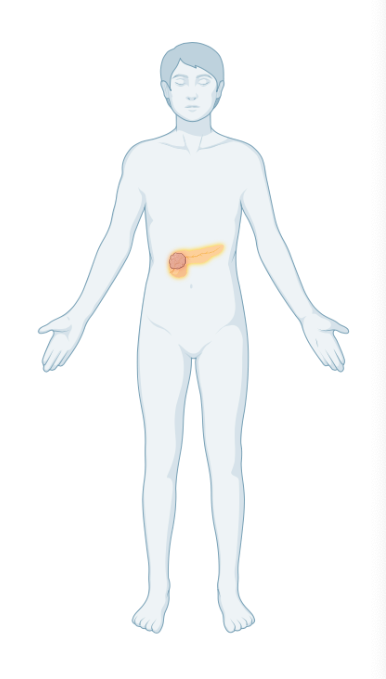
Pancreatic Ductal Adenocarcinoma
| PDC Study Identifier | PDC000270 |
| Study | Proteogenomic characterization of pancreatic ductal adenocarcinoma |
| Quantitation strategy | Isobaric label quantitation |
| Isobaric Labeling reagent | TMT11 |
| # proteome plexes | 25 |
| # fractions per proteome plex | 25 |
| # tumour samples | 137 |
| # adjacent normal sample | 74 |
Uterine Corpus Endometrial Carcinoma
| PDC Study Identifier | PDC000125 |
| Study | Proteogenomic Characterization of Endometrial Carcinoma |
| Quantitation strategy | Isobaric label quantitation |
| Isobaric Labeling reagent | TMT10 |
| # proteome plexes | 17 |
| # fractions per proteome plex | 24 |
| # tumour samples | 100 |
| # adjacent normal sample | 49 |
W>F Substitutants in the peptides are shown with a lowercase f. The column 'Total' accounts for the total occurences of the peptide in all samples. The column 'Σ Total' accounts for the total of occurences in tumor tissue samples and the column 'Σ Normal' accounts for the total of occurences in adj. normal tissue samples. The following columns showcases for each sample whether the peptide is found.